Η τελευταία (απότομη) πτώση στα αμερικάνικα χρηματιστήρια έφερε ρίγη στις παγκόσμιες αγορές μετοχών υπενθυμίζοντας μας ότι η αμερικάνικη (και όχι μόνο) φούσκα μπορεί ανά πάσα στιγμή να σκάσει συμπαρασύροντας και το ΧΑΑ.
Για το θέμα αυτό βρήκα ένα πολύ ενδιαφέρον άρθρο τεχνικής ανάλυσης συγκεκριμένου διαγραμματικού μοτίβου που δημοσιεύτηκε από τον Tushar Chande στο www.stockcharts.com
Here I explore recent key lows and bottoming patterns in the S&P
500 in order to understand how they may apply to the current market
decline. Naturally, the past may give us clues, but there is always
uncertainty about how the bottom will form this time. For obvious
reasons, I will ignore "V" bottoms, that often form during up-trends,
since they require no further elaboration.
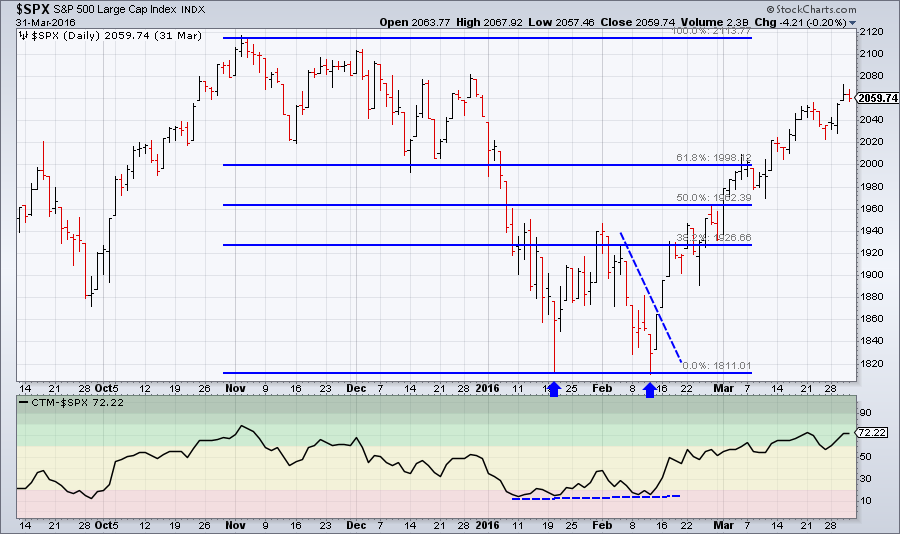 Chart
1: A template for S&P 500 Double Bottoms The initial low is
followed by a rebound into the Fibonacci retracement zone. A relatively
rapid 8-10 day decline is a firm test of the initial low. A rapid rally
recovers the second retest decline in roughly half the time (4-5) days
and the market rises through the Fibonacci retracement zone to make new
highs.
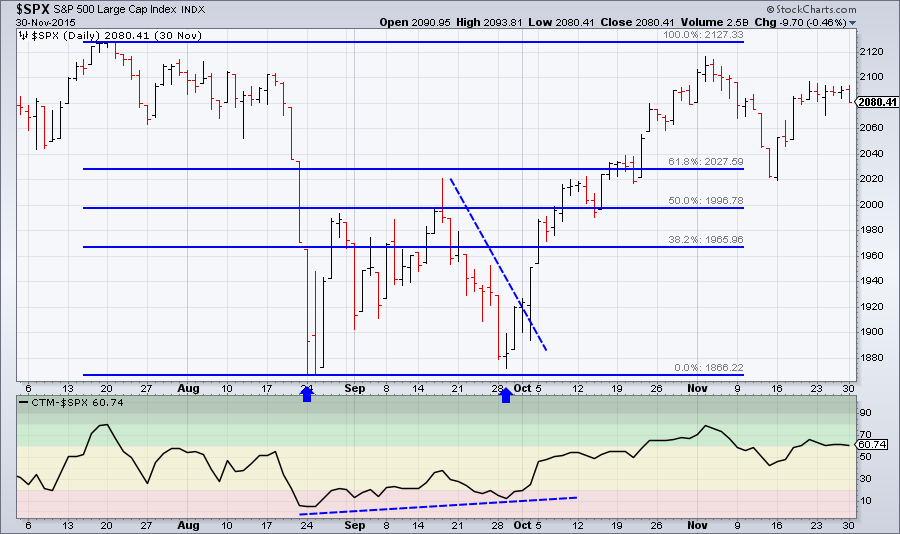 Chart
2: The August/September 2015 low followed the same template as Chart
1. An initial low, then a rebound into the Fibonacci retracement zone, a
8-10 day sell-off to retest the low and then a quick recovery rebound
off the second low.
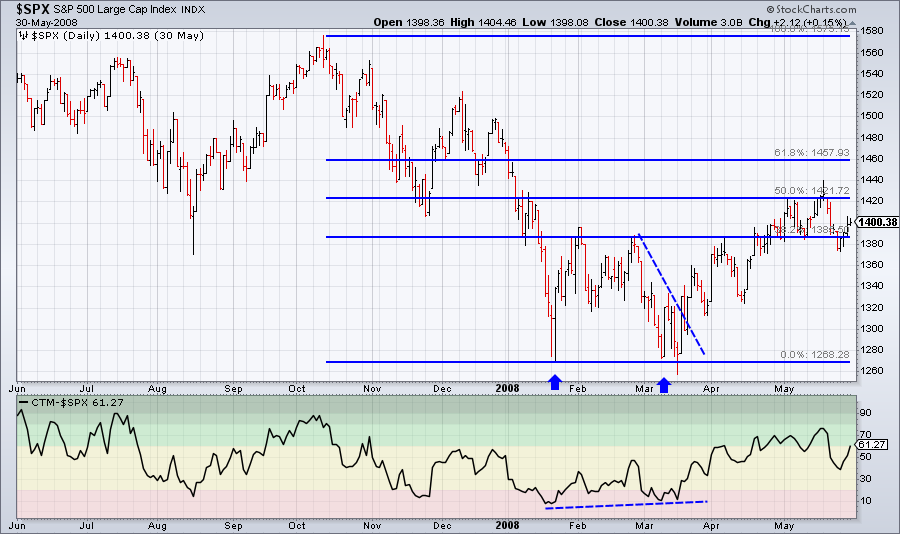 Chart
3: Knowing what followed later in 2008, this low shows that it followed
the template in Chart 1, but the rebound was only a brief respite.
Hence, the bottoms can be vulnerable failure later in the sequence.
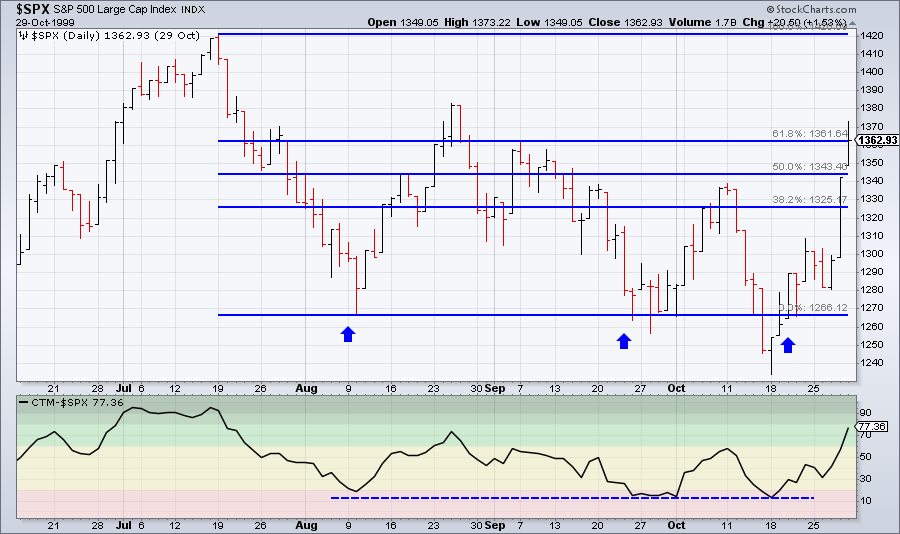 Chart
4: In 1999 we see a more complex bottoming process that also gives us
clues for the failure mode. Here the rebound off the initial low went
above the 62% Fibonacci rebound level. Then there was a lazy decline
to retest the original low, followed by expected rapid rise off the
bottom. However, instead of the follow through, we get another test of
the initial low, that formed a marginal new low, so we can only loosely
call this a triple bottom. The rapid rally off the third low is
similar to the recovery rally in the template from Chart 1.
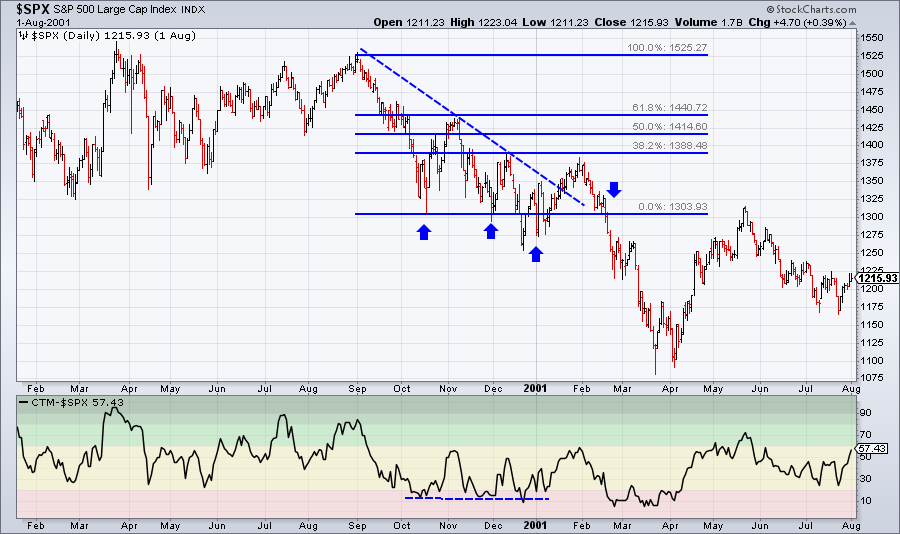 Chart
5: The failure mode in 2000-2001 is important to understand how the
pattern can fail. A loose triple bottom (as in Chart 4) fails to
follow-through above the initial Fibonacci retracement zone, and breaks
down, below the initial low for a fourth time. The attempt at the
fourth retest of the initial low failed and the down-trend resumed.
I can summarize the bottoming process as follows:
1. Initial low forms.
2. Market rebounds into Fibonacci retracement zone, confirming location of initial low.
3. A relatively rapid 8-10 day decline into the first low forms the second low.
4. Market rebounds rapidly off the second low to resume uptrend.
5. The Chande Trend Meter is below 20 and we may see a positive divergence at the second low.
6. A third retest of the initial low with a marginally lower low is possible.
7. A third low open the possibility of a failed bottom pattern, and we should be alert to the risk of fresh new lows negating the pattern.
The amplitude of the current decline is in line with historical declines. Bloomberg has a nice chart of declines from new highs since 1945. If we remove the declines worse than -15%, then the average decline is -11.34%, and lasted 63 days on average. Hence, the current decline, which has covered about -11.8% is right near the average. However, we are only a few days into the decline.
We have located the initial low, since the rebound has taken us to the top of the Fibonacci retracement zone. The Chande Trend Meter is well above 20 [η υπογράμμιση δική μου], so this has been quite a rapid descent. If the market were to follow the template of Chart 1, we should see a 8-10 day decline to retest the 2532 low, followed by a rebound to new highs. Will the market actually do that? Only time will tell.
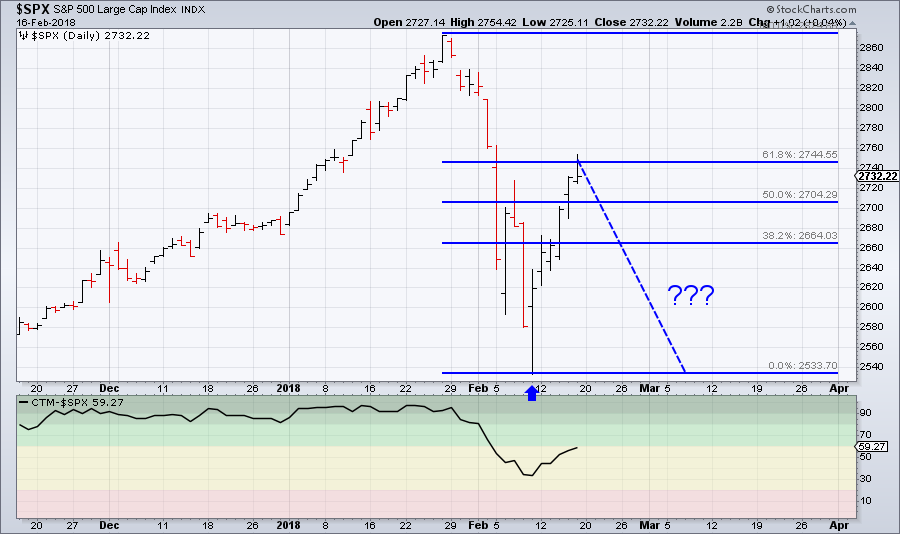 Chart
6: The current decline has formed the initial low and rebounded into
the Fibonacci retracement zone. We have two possibilities here. One,
the market continues to new highs and forms a "V" bottom. The second
possibility is that we will see a 8-10 day sell-off to retest the second
low. Note that the Chande Trend Meter is well above 20, which breaks
the pattern, and may imply that a "V" bottom is more likely. Only time
will tell.
I touched on the bottoming process in my previous posts (here, and here). Others, notably Tom Bowley (here and here), Martin Pring and Art Hill have also touched upon the topic, so you may also wish to check out their thoughts as well.
 Chart
1: A template for S&P 500 Double Bottoms The initial low is
followed by a rebound into the Fibonacci retracement zone. A relatively
rapid 8-10 day decline is a firm test of the initial low. A rapid rally
recovers the second retest decline in roughly half the time (4-5) days
and the market rises through the Fibonacci retracement zone to make new
highs.
Chart
1: A template for S&P 500 Double Bottoms The initial low is
followed by a rebound into the Fibonacci retracement zone. A relatively
rapid 8-10 day decline is a firm test of the initial low. A rapid rally
recovers the second retest decline in roughly half the time (4-5) days
and the market rises through the Fibonacci retracement zone to make new
highs.A Template For S&P 500 Bottoms
The 2016 double bottom in Jan/Feb offers a useful template (see Chart 1). First, note that the initial low is followed by a retracement into the 38.2% - 61.8% Fibonacci range i.e., in rough terms, a rebound of 38% to 62% of the amplitude of the decline leading into the first low. Then, there is a fairly rapid decline to retest the first low, that usually seems to occur in 8-10 trading days. The rebound off the second low is very rapid, recovering the decline over the previous 8-10 day range in 3-5 days. The Chande Trend Meter has fallen below 20, and may show a flat trend even a positive divergence.The 2015 Bottom
The $SPX August/September 2015 bottom follows the same template as Chart 1. The rebound off the initial low was into the Fibonacci 38.2%-68.2% retracement region, followed by a rapid 8-day sell-off to retest the first low. The Chande Trend Meter (CTM) was below 20 and we see a slight positive divergence in the CTM in to the second low. The recovery rebound was a four day affair into the Fibonacci retracement zone. Chart
2: The August/September 2015 low followed the same template as Chart
1. An initial low, then a rebound into the Fibonacci retracement zone, a
8-10 day sell-off to retest the low and then a quick recovery rebound
off the second low.
Chart
2: The August/September 2015 low followed the same template as Chart
1. An initial low, then a rebound into the Fibonacci retracement zone, a
8-10 day sell-off to retest the low and then a quick recovery rebound
off the second low.March 2008 Bottom
Knowing what came later in 2008, I hesitate to call this a bottom, but it fits the Chart 1 template. An initial low followed by a retracement into the Fibonacci zone, then a 8-10 day decline to form a second bottom. Here the bounce off the bottom was quite slow, perhaps showing the reluctance of the market. However, the Chande Trend meter was below 20 and showed positive divergence. Chart
3: Knowing what followed later in 2008, this low shows that it followed
the template in Chart 1, but the rebound was only a brief respite.
Hence, the bottoms can be vulnerable failure later in the sequence.
Chart
3: Knowing what followed later in 2008, this low shows that it followed
the template in Chart 1, but the rebound was only a brief respite.
Hence, the bottoms can be vulnerable failure later in the sequence.The 1999-Bottoming Process
In 1999 we had what amounts to a triple bottom. The rebound off the first low took the market outside the Fibonacci retracement zone. A slow decline (20-22 days) into the second low gave the usual rapid rebound into the Fibo zone. However, this was followed by a third rapid retest, that took only 4 days and formed a new low, so it is not strictly correct to call it a double bottom, but we will loosely call it a triple bottom. The Chande Trend Meter was below 20 for each of the lows, and one could argue it did not make a new low at the third bottom, so perhaps that was a sign of the rebound to follow. Chart
4: In 1999 we see a more complex bottoming process that also gives us
clues for the failure mode. Here the rebound off the initial low went
above the 62% Fibonacci rebound level. Then there was a lazy decline
to retest the original low, followed by expected rapid rise off the
bottom. However, instead of the follow through, we get another test of
the initial low, that formed a marginal new low, so we can only loosely
call this a triple bottom. The rapid rally off the third low is
similar to the recovery rally in the template from Chart 1.
Chart
4: In 1999 we see a more complex bottoming process that also gives us
clues for the failure mode. Here the rebound off the initial low went
above the 62% Fibonacci rebound level. Then there was a lazy decline
to retest the original low, followed by expected rapid rise off the
bottom. However, instead of the follow through, we get another test of
the initial low, that formed a marginal new low, so we can only loosely
call this a triple bottom. The rapid rally off the third low is
similar to the recovery rally in the template from Chart 1.How This Bottoming Pattern Fails (2000-2001)
It is also useful to understand how the double bottom fails. In late 2000, we had the initial signs of a bottom along the template of Chart 1. The initial bottom was followed by expected rebound into the Fibonacci range. A somewhat slow dribble down into the initial low gave us the retest. Then, the subsequent rebound was halted at the lower edge of the Fibonacci zone and a third retest of the initial low made a new low, still within our loose triple bottom like 1999. However, the rebound again stalled at the bottom of the Fibonacci zone, and a new low (down arrow) clearly broke even the 1999 template. In any case, any purchases near the initial low would have been a low-risk entry point that would have allowed the usual risk control dollar hard stop to exit the trade with modest losses. Chart
5: The failure mode in 2000-2001 is important to understand how the
pattern can fail. A loose triple bottom (as in Chart 4) fails to
follow-through above the initial Fibonacci retracement zone, and breaks
down, below the initial low for a fourth time. The attempt at the
fourth retest of the initial low failed and the down-trend resumed.
Chart
5: The failure mode in 2000-2001 is important to understand how the
pattern can fail. A loose triple bottom (as in Chart 4) fails to
follow-through above the initial Fibonacci retracement zone, and breaks
down, below the initial low for a fourth time. The attempt at the
fourth retest of the initial low failed and the down-trend resumed.Summary of S&P 500 Bottom Pattern
I can summarize the bottoming process as follows:
1. Initial low forms.
2. Market rebounds into Fibonacci retracement zone, confirming location of initial low.
3. A relatively rapid 8-10 day decline into the first low forms the second low.
4. Market rebounds rapidly off the second low to resume uptrend.
5. The Chande Trend Meter is below 20 and we may see a positive divergence at the second low.
6. A third retest of the initial low with a marginally lower low is possible.
7. A third low open the possibility of a failed bottom pattern, and we should be alert to the risk of fresh new lows negating the pattern.
Are We There Yet?
The amplitude of the current decline is in line with historical declines. Bloomberg has a nice chart of declines from new highs since 1945. If we remove the declines worse than -15%, then the average decline is -11.34%, and lasted 63 days on average. Hence, the current decline, which has covered about -11.8% is right near the average. However, we are only a few days into the decline.
We have located the initial low, since the rebound has taken us to the top of the Fibonacci retracement zone. The Chande Trend Meter is well above 20 [η υπογράμμιση δική μου], so this has been quite a rapid descent. If the market were to follow the template of Chart 1, we should see a 8-10 day decline to retest the 2532 low, followed by a rebound to new highs. Will the market actually do that? Only time will tell.
 Chart
6: The current decline has formed the initial low and rebounded into
the Fibonacci retracement zone. We have two possibilities here. One,
the market continues to new highs and forms a "V" bottom. The second
possibility is that we will see a 8-10 day sell-off to retest the second
low. Note that the Chande Trend Meter is well above 20, which breaks
the pattern, and may imply that a "V" bottom is more likely. Only time
will tell.
Chart
6: The current decline has formed the initial low and rebounded into
the Fibonacci retracement zone. We have two possibilities here. One,
the market continues to new highs and forms a "V" bottom. The second
possibility is that we will see a 8-10 day sell-off to retest the second
low. Note that the Chande Trend Meter is well above 20, which breaks
the pattern, and may imply that a "V" bottom is more likely. Only time
will tell.Looking Ahead
The 2018 market is not quite following the template of Chart 1 since the CTM is above 20 (perhaps due to the speed of the decline). So we have to watch exactly how the pattern develops, but at least we can narrow the possibilities to two at the moment, which is actually quite helpful. I am leaning towards a replay of the template in Chart 1, but only time will tell.I touched on the bottoming process in my previous posts (here, and here). Others, notably Tom Bowley (here and here), Martin Pring and Art Hill have also touched upon the topic, so you may also wish to check out their thoughts as well.


Δεν υπάρχουν σχόλια:
Δημοσίευση σχολίου